D4. Reporting and Stakeholder Communication
Metrics and evaluation (chapter D1) supply the raw data; reporting connects them to strategic steering and makes them usable for different audiences, from the operational team huddle to the oversight body. Without structured reporting, even good metrics remain ineffective because they never reach the people who decide on their basis.
What this chapter delivers: an audience overview that assigns each group its reporting instrument, and then those instruments themselves: three dashboards for internal steering, fixed reporting cadences, the template for the board report, and the transparency evidence for external stakeholders.
Audiences and their information needs
Reporting does not begin with the dashboard but with the question of who makes which decision and what they need to know for it. The same metric is prepared differently for each group: the board needs the value contribution in euros, the operations team the error rate in percent. The Sphere column shows at a glance whether an audience is internal, belongs to external oversight, or to market and public; the instrument column names each group’s reporting format, delivered by the following sections. The table lists the typical audiences of an AI program; depending on the company, others are added, such as investors or industry bodies.
| Sphere | Audience | Core question | Decision they make | Instrument for it |
|---|---|---|---|---|
| Internal | Board, oversight body | Does the AI strategy pay into the corporate goals? | Budget, portfolio direction, stop or go | strategic dashboard and board report |
| Internal | Program and area leadership | Are the use cases running to plan? | Prioritization, resources, escalation | tactical dashboard and portfolio review |
| Internal | Operational teams (product owner, data science, operations) | Does the system work technically? | Operation, retraining, incident response | operational dashboard and alerts |
| Internal | Employees and employee representation | How does AI change our work, and is its use co-determined? | Acceptance, co-determination, upskilling | communication and enablement from chapter B11, no dashboard of its own |
| External: oversight | Regulators, auditors, supervision | Is the use compliant and substantiable? | Approval, audit opinion | explainability and audit reports, audit trails |
| External: market and public | Customers, affected persons, and public | Where and for what is AI used, and how does it affect me? | Trust, usage, exercising rights | labeling, information, and transparency reports |
The three dashboards of internal steering
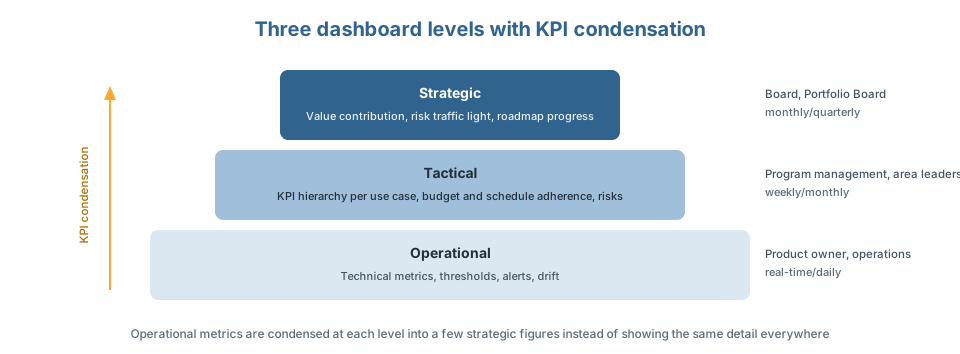
The first three audiences of the overview steer the AI portfolio continuously; their instrument is one dashboard each, a continuously updated metric view. The level of a dashboard is nothing other than the altitude of its audience: strategic for the board and Portfolio Board, tactical for program and area leadership, operational for the teams. One dashboard per level keeps operational detail from overwhelming management, and strategic metrics from leaving operations flying blind.
| Dashboard | Audience | Content | Update cadence |
|---|---|---|---|
| Strategic | Board, Portfolio Board | A few aggregated KPIs: value contribution, risk traffic light, roadmap progress | monthly/quarterly |
| Tactical | Program management, area leadership | KPI hierarchy per use case, budget and schedule adherence, open risks | weekly/monthly |
| Operational | Product owner, data scientist, operations | Technical metrics, thresholds, alerts, drift | real-time/daily |
KPI hierarchy: operational metrics (model quality, data quality, cost per request) are condensed at each level into a few strategic figures (revenue contribution, customer satisfaction, risk exposure), instead of showing the same level of detail everywhere.
Reporting cadences
The dashboards show the current state at any time; the cadences define when each audience actively receives and discusses it. Fixed cadences with named owners ensure that reporting doesn’t only happen when something occurs, and that problems don’t become visible only once they have escalated. The table shows the recommended base rhythm, to be adapted to your own governance structure.
| Cadence | Format | Audience | Content | Owner |
|---|---|---|---|---|
| Weekly | Status meeting per product | Operational team | Progress, blockers, next steps | Product owner |
| Monthly | Portfolio review | Program and area leadership | Status of all use cases, budget, risks | AI program lead |
| Quarterly | Board report | Board, oversight body | Strategy progress, value contribution, key risks, regulatory updates | Chief AI Officer / executive sponsor |
| As needed | Ad-hoc notification | up to the board, depending on severity | Security incidents, threshold breaches, regulatory deadlines | Owner of the relevant topic |
Template: board report (short form)
The board report is the quarterly instrument of the first audience, the board and oversight body. Each block answers a question the body will ask. A report that leaves one of these questions open generates follow-up questions instead of decisions.
| Block | Key question | Example |
|---|---|---|
| Value contribution | What has the investment delivered so far, measured against the business case? | “Reply suggestions service: 140,000 euros saved after 6 months, plan: 160,000 euros” |
| Portfolio status | How many use cases are in which phase (Assess to Operate)? | 2 in Pilot, 1 in Scale, 3 under evaluation |
| Risk traffic light | Which top risks exist, with what trend? | Vendor dependency: yellow, rising |
| Regulation | Which deadlines and changes affect us (see chapter B8)? | Transparency obligations effective Aug 2, 2026 implemented |
| Cost | Are we within budget, and what is the full-year forecast? | 82% of the annual budget used, forecast on track |
| Decisions needed | Which concrete decision should the body take? | Budget approval wave 3: 250,000 euros |
Presentation: a report convinces not through density of figures but through the link between number and meaning. Each block states the value, the comparison (plan, previous month, or threshold), and the consequence. Traffic-light colors are defined uniformly, so that “yellow” means the same thing in every report.
Transparency toward external stakeholders
The two external audiences of the overview (regulators, auditors, and supervision as well as customers, affected persons, and the public) get no dashboards but substantiable evidence. In the table below, they fan out further, from supervision down to the individual affected person:
| Recipient | What is disclosed | How it is substantiated |
|---|---|---|
| Regulators and supervision | how it works, data origin, risk class, type of human oversight | explainability reports and documentation, as chapter B8 requires |
| Auditors and certification bodies | which data and parameters applied at the time of the decision | gapless audit trails, so every report can be substantiated after the fact |
| Affected persons | that an automated decision was made, its essential logic, and the rights to information and objection | information and explanation on request, documented decision basis (see chapter B10) |
| Customers | that and for what AI is used, labeling of generated content | understandable notices at the point of contact |
| Public and media | responsible AI use in principle and the handling of incidents | transparency reports and model documentation, proactive communication on incidents |
Automation and culture
Reporting only endures if it requires neither manual work nor whitewashing. Two technical building blocks and one cultural one secure that:
- Automated reporting: dashboards and standard reports are generated from the same data sources as operational monitoring, not rebuilt manually.
- Escalation and alerting mechanisms: threshold breaches trigger defined notification paths, independent of the next regular reporting date.
- Culture of openness: honest reports rather than polished presentations require an open error culture. A report that shows only successes quickly loses trust.
Checklist: reporting and stakeholder communication
The checklist verifies that reporting reaches all levels and audiences:
- Audiences and their information needs determined: who makes which decision, at which altitude
- Communication to employees and employee representation regulated
- Dashboard per steering level (strategic, tactical, operational) set up
- KPI hierarchy from operational to strategic metrics defined
- Reporting cadences with owners established
- Board report template in use, traffic-light colors defined uniformly
- Ad-hoc notification paths for incidents and threshold breaches active
- Reporting automated from the same sources as operational monitoring
- Transparency obligations toward regulators, auditors, affected persons, customers, and the public fulfilled
- Audit trails complete: traceable which data and parameters applied at the time of the decision
- Culture of openness anchored: reports show setbacks too, not only successes