D1. Metrics and Evaluation
AI succeeds only if its impact is measurable. Without traceable metrics, it stays unclear whether solutions meet their goals, create risk, or justify investment.
What this chapter delivers: the full metrics system for all levels, from technical performance through to business contribution: four metric categories, specific metrics for generative AI and agents, thresholds, and evaluation methods. The starting point is the set of strategic metrics that executive management defined in chapter B1.
Four metric categories at a glance
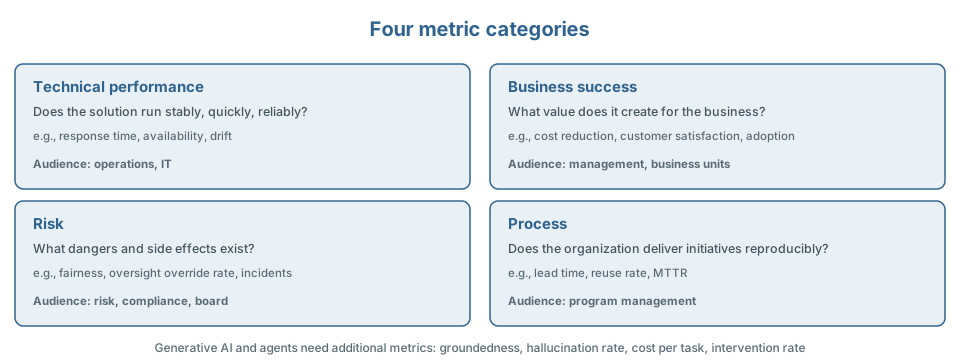
AI impact cannot be captured with a single number. The metrics fall into four categories, each with its own guiding question and its own audience:
| Category | Question | Audience |
|---|---|---|
| Technical performance | Does the solution run stably, quickly, reliably? | Operations, IT |
| Business success | What value does it create for the business? | Management, business units |
| Risk | What dangers and side effects exist? | Risk, compliance, board |
| Process | Does the organization deliver initiatives reproducibly? | Program management |
Technical performance metrics
- Response time and throughput
- Scalability
- Availability and resilience (uptime, MTBF)
- Accuracy and error rates, measured at the application level across the full pipeline (data ingestion, preprocessing, inference, output), not just at the model level
- Robustness and drift (divergence of current input from the training data as a trigger for retraining)
- Integration reliability (error rates at interfaces)
- Resource consumption (cost and sustainability impact)
Business success metrics
- Revenue growth and new revenue models
- Cost reduction and efficiency gains
- Customer satisfaction and retention (NPS, handling time, repeat-purchase rate)
- Productivity and quality
- Time-to-market and innovation capability
- Risk and compliance contribution
- Sustainability
Plus the adoption metrics from chapter B11 (usage rate, implementation rate, training coverage): a technically good solution without usage delivers no business value.
Risk metrics
- Model errors and error rates
- Bias and fairness: differences in accuracy and decisions across groups (see chapter B10)
- Override rate of human oversight: share of cases where oversight persons deviate from the system’s suggestion; a rate near zero at high case volume signals rubber-stamping
- Robustness and security (stability under disturbance, success rate of attack simulations)
- Data-protection and compliance violations
- Operational reliability
- Reputational risk
- Financial risk from wrong decisions
Process metrics
- Lead time from idea to production
- Reuse rate
- Quality assurance and governance
- Cross-disciplinary collaboration
- Automation and MLOps maturity
- Change and incident management (MTTR, rollback rate)
- Training and knowledge building
Specific evaluation for generative AI and agents
Generative models produce open-ended output and need their own metrics that classical ML metrics do not cover:
- Faithfulness / grounding: share of claims backed by sources (central for RAG).
- Hallucination rate: share of factually incorrect but plausibly worded output.
- Relevance and completeness: does the output actually answer the question?
- Safety / toxicity: share of impermissible or harmful output.
- Robustness against prompt injection: success rate of attack simulations.
- Cost per task: tokens or API cost per completed task (bridge to chapter D2).
- For agents additionally: end-to-end task success rate, share of correct tool calls, intervention rate (human-in-the-loop), rate of irreversible mistaken actions (target: zero).
Method: a versioned evaluation suite with fixed test cases (including negative and attack cases) runs automatically on every change. For open-ended output, human evaluation is combined with model-based evaluation against a reference.
Template: metrics catalog with example thresholds
Thresholds are application-dependent. The values below are illustrative starting points to be adjusted by criticality.
| Metric | Example target | Alert threshold |
|---|---|---|
| Availability (uptime) | at least 99.5% | below 99.0% |
| Response time (P95) | under 2s (interactive) | over 4s |
| Model quality vs. baseline | at least 10% better | below baseline |
| Data drift | within tolerance | significant deviation → review |
| Hallucination rate (generative) | under 2% of outputs | over 5% |
| Faithfulness (RAG) | at least 95% grounded | below 90% |
| Fairness deviation across groups | below defined threshold | exceeded |
| Oversight override rate | application-dependent, as a rough heuristic 3 to 15% | near 0% at high case volume → check for rubber-stamping |
| Usage rate (adoption) | at least 60% of eligible users after 3 months | falling trend across 2 measurement points |
| MTTR (recovery) | under 1h | over 4h |
| Cost per request | within budget | over budget plus 20% |
Evaluation methods
Metrics define what is measured; the following methods define how reliably it is measured. Depending on the criticality of the use case, several methods are combined:
- Experimental validation: separate training and test data, reproducible, logged experiments.
- A/B tests and controlled rollouts: objective proof of added value against a control group; staged rollout minimizes risk.
- Benchmarking against baselines: comparison against simple rules or prior methods, to prove genuine added value.
- Simulation-based evaluation: virtual environments and digital twins check impact before real processes are touched, especially where real tests are expensive or risky (manufacturing, logistics, financial services).
- Scenario and stress tests: behavior under unusual inputs, high load, and failure conditions; makes resilience visible.
- User-centered evaluation: surveys, usability tests, observation; technical precision is worthless if results aren’t accepted.
- Continuous monitoring and feedback loops: drift detection and user feedback in improvement cycles.
- Audits and external reviews: independent reviews for critical applications (health, finance, government).
Checklist: metrics and evaluation per use case
The checklist verifies per use case that measurement and evaluation hold up; how the metrics are then reported is covered in chapter D4:
- Success criterion and baseline defined before the start
- Metrics defined from all four categories: technical performance, business success, risk, and process
- Adoption metrics included, because a technically good solution nobody uses delivers no business value
- For generative AI: hallucination, grounding, and safety measured
- For agents: task success rate, correct tool calls, intervention rate, and irreversible faulty actions measured
- Evaluation suite with negative and attack cases available, versioned and run automatically on every change
- Evaluation methods combined to match criticality (baseline comparison, A/B test, stress test, user-centered review, external audits)
- Thresholds and alerts defined
- Drift monitoring active
- Dashboard and reporting cadence established (see chapter D4)
- Audit trail for critical decisions available