B2. Identifying and Prioritizing Use Cases
Whether an AI program creates value is decided less by the technology than by selection: use cases get launched that are technically impressive but create little value, or there’s no traceable sequencing.
What this chapter delivers: an end-to-end method from idea generation through evaluation and prioritization to the business case, including templates for direct use. The search space is bounded by the focus fields from chapter B1: searching and evaluating happens primarily where executive management wants to invest. The results feed into the Portfolio Board (see chapter B7) and into the roadmap (chapter C2).
Step 1: Finding use cases
Good use cases don’t emerge from “Where could we use AI?” but from “Where does it hurt, and where is there data?” Four search fields have proven effective:
- Process pain points: manual, repetitive, error-prone, or slow steps. Source: process maps, complaints, processing times.
- Data-rich decisions: recurring decisions with plenty of available data, such as credit approval, prioritization, or forecasting.
- Bottlenecks around scarce expertise: tasks that today depend on a small number of experts.
- Competitive and customer pressure: areas where others already differentiate with AI.
Method: in a facilitated workshop per business unit, hypotheses are collected for each search field and phrased as a single sentence: “We believe that [AI capability] in [process] creates [measurable benefit] for [target group].” Each hypothesis is then fleshed out using the profile below.
Template: use-case profile (use-case canvas)
Each field answers a question that later decides success or failure. If a field stays empty, the use case is not ready for evaluation.
| Field | Key question and why it matters | Example |
|---|---|---|
| Title | Short name under which the case is tracked in the portfolio | “Reply suggestions customer service” |
| Problem / trigger | Which pain point is addressed? Without a real problem, you build a solution nobody uses. | Service response time is 2 days, customers churn |
| User group | Who uses the result day to day? If this is unclear, acceptance will be missing later. | 40 service staff in existing-customer support |
| AI capability | Prediction, classification, generation, or agent? The answer determines architecture, risk, and metrics (see chapter A2). | Generation (reply drafts from ticket history) |
| Expected benefit | Measurable in time, cost, revenue, quality, or risk. Without a number, success can never be proven. | Handling time per ticket from 20 to 8 minutes |
| Data needed | Which sources, in what quality, with what protection needs? The most common cause of failure is that the data doesn’t exist in usable form. | 3 years of ticket history, personal data, pseudonymizable |
| Decision/action | What happens with the result, and who decides? Clarifies whether a human reviews or the system acts directly. | Staff review and send the draft |
| Regulatory classification | Prohibited, high-risk, transparency obligation, or minimal? A late classification can stop the whole effort (see chapter B8). | Transparency obligation (generated content) |
| Success criterion | How will success be measured in phase 1? Must be fixed before the start, otherwise results get talked up. | 50% of drafts are adopted without changes |
| Assumptions / risks | What must hold true for the case to work? Surfaces the biggest uncertainties before money flows. | Assumption: ticket history covers 80% of inquiry types |
Step 2: Evaluate with value and feasibility
This step turns every profile from step 1 into two numbers: a value score and a feasibility score, each between 1 and 5. These two numbers then determine the position in the prioritization matrix and with it the recommended action. A joint assessment by the business unit, IT/data science, and risk/compliance is recommended to balance optimism against blind spots.
Template: evaluation scorecard
How the scorecard works: each criterion is rated from 1 (very low) to 5 (very high) and multiplied by its weight. The weights per dimension add up to 100 percent; as a result, each dimension’s score again lands between 1 and 5. The sum of the weighted value rows yields the value score, the sum of the weighted feasibility rows the feasibility score. The weights are a proven starting point and can be adapted, as long as they are fixed before the evaluation and add up to 100 percent per dimension.
| Dimension | Criterion | What is concretely checked | Weight | Rating (1 to 5) | Weighted (rating × weight) |
|---|---|---|---|---|---|
| Value | Size of the business benefit | How large is the effect on cost, revenue, quality, or risk in euros per year? | 50% | ||
| Value | Strategic importance | Does the case contribute to a top corporate goal, or is it only locally useful? | 30% | ||
| Value | Reusability | Can data, building blocks, or insights be reused in other areas? | 20% | ||
| Value score: | sum of the three rows | ||||
| Feasibility | Data availability | Does the data exist in sufficient quantity and quality, and is access permitted? | 40% | ||
| Feasibility | Technical feasibility | Are there proven methods and existing building blocks, or is research required? | 20% | ||
| Feasibility | Regulatory and ethical risk | The lower the risk class (chapter B8) and fairness risk (chapter B10), the more feasible | 20% | ||
| Feasibility | Organizational maturity | Is there a responsible person and a receptive business unit? | 20% | ||
| Feasibility score: | sum of the four rows |
Worked example for the use case “reply suggestions in customer service”: business benefit is rated 4, strategic importance 3, reusability 2. The value score is then 4 × 50% + 3 × 30% + 2 × 20% = 2.0 + 0.9 + 0.4 = 3.3. For feasibility: data availability 4, technical feasibility 4, risk 3, organizational maturity 4 gives 4 × 40% + 4 × 20% + 3 × 20% + 4 × 20% = 1.6 + 0.8 + 0.6 + 0.8 = 3.8. The case therefore has a value score of 3.3 and a feasibility score of 3.8.
Template: prioritization matrix (value × feasibility)
How the transfer works: the feasibility score determines the column (horizontal axis), the value score the row (vertical axis). A score below 3 counts as low, 3 and above as high; the boundary can be adjusted per portfolio. The example above (value 3.3, feasibility 3.8) therefore lands in the top-right quadrant. The matrix translates the evaluation into a recommended action per quadrant: it answers not only whether a use case is good, but what to do with it now. Without this step, the technically most exciting case typically gets built first instead of the most valuable one.
| Low feasibility | High feasibility | |
|---|---|---|
| High value | Strategic bets: prepare thoroughly, remove obstacles deliberately, possibly in stages | Lighthouses first: start immediately, generate visible wins |
| Low value | Avoid: don’t start, document and shelve | Fillers: only with spare capacity, ideally automated or bought in |
What the four quadrants mean:
- Lighthouses first (high value, high feasibility): a lighthouse is a highly visible showcase project. These cases deliver a lot and are readily achievable; they are started first because their visible wins secure trust and budget for everything that follows.
- Strategic bets (high value, low feasibility): the potential benefit is large, but prerequisites are still missing today (data, competence, legal clarification). A bet is not started immediately; it is prepared deliberately until the obstacles are removed.
- Fillers (low value, high feasibility): easy to implement but of limited benefit. They fill spare capacity but do not justify their own priority; often a bought product is the better solution.
- Avoid (low value, low feasibility): neither worthwhile nor readily achievable. These cases are documented and shelved, so the decision stays traceable and the idea is not re-examined every six months.
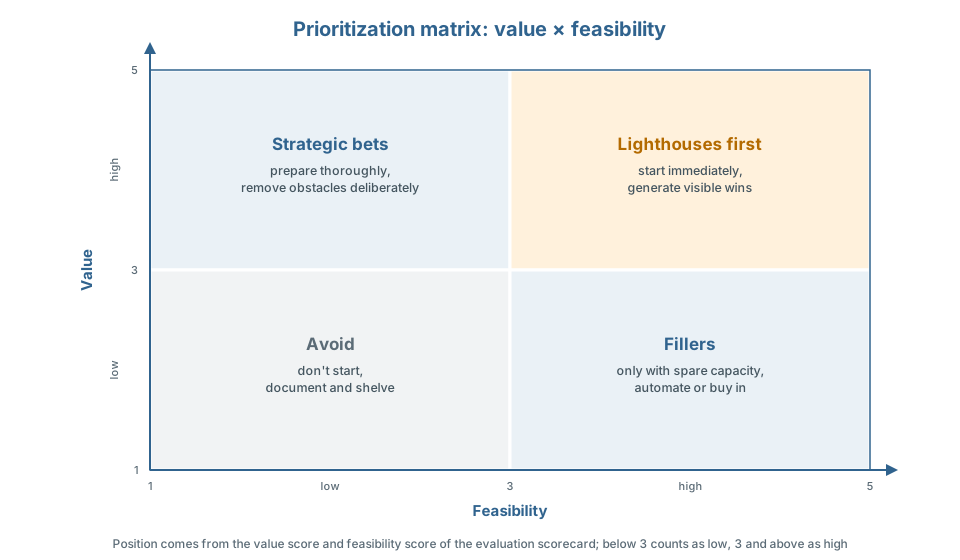
Rule for the first wave: two to three use cases from the “lighthouses first” quadrant, complemented by one carefully prepared “strategic bet.” This produces quick wins while building the learning curve for the more demanding effort.
Step 3: Decide the sourcing path
Before a business case is calculated, the sourcing path needs to be clarified. Quick filter:
- Buy (standard product/SaaS) if the use case is a solved standard problem and creates no differentiation, such as text recognition or standard transcription.
- Build yourself if the use case is based on exclusive data, is core to differentiation, or has particular sovereignty or data-protection requirements.
- Implement with a partner if competence or capacity is lacking but the use case is strategic, with a clear exit strategy and ownership of data and artifacts.
Rule of thumb: build differentiation yourself, buy standard functionality, bridge gaps with partners. Never give up data sovereignty over a differentiating use case. The detailed decision matrix and vendor questionnaire are in chapter B3.
Step 4: Calculate the business case
A uniform, lean business case is built for the prioritized use cases. It’s important to honestly separate one-time and ongoing costs. Inference costs in particular are routinely underestimated.
Formulate the value-driver chain first: before any calculation, spell out the mechanism as a chain: which activity does the use case change, which metric does that move, and which corporate goal does the metric contribute to? Example: reply suggestions in customer service → handling time per ticket drops from 20 to 8 minutes → service cost per case falls → contributes to the corporate goals of cost reduction and customer retention. The links of the chain also provide the baseline and the measuring points for later evaluation (see chapter D1). A chain that cannot be formulated is the earliest warning sign of a weak business case.
Template: business case (short form)
How the business case is calculated: for the prioritized use cases, each of the following blocks is filled in. What matters is the honest separation of one-time and ongoing costs, and a range instead of false precision.
| Block | Key question | Example |
|---|---|---|
| Baseline (today) | What does today’s state cost without AI? Without a baseline, no before-and-after comparison is possible. | 20 minutes per ticket × 30,000 tickets per year |
| Expected benefit per year | Quantified, with assumptions and a range (best, average, worst). The range forces honesty about uncertainty. | 180,000 to 320,000 euros in time savings |
| One-time costs | Data, development, integration, training | 120,000 euros |
| Ongoing costs per year | Inference/API, operations, monitoring, maintenance, licensing. The most frequently underestimated block. | 45,000 euros (of which 25,000 euros API costs) |
| Economics | ROI, payback period, total cost of ownership | Payback after approx. 9 months |
| Non-monetary benefit | Risk, quality, employee and customer satisfaction | Shorter response times, lower staff turnover |
| Sensitivity | Which assumption would flip the case? Shows where to look more closely. | Adoption rate below 30% makes the case negative |
Checklist: is the use case ready to start?
The checklist bundles the chapter’s four steps; only when every item is met is the use case ready for the portfolio:
- Use-case profile filled in completely, no field left open
- Problem and measurable benefit stated in one sentence
- User group named and AI capability determined (prediction, classification, generation, or agent)
- Success criterion for phase 1 defined and verifiable
- Required data identified, available, and of sufficient quality
- Data-protection and protection needs clarified
- Regulatory classification obtained (see chapter B8)
- Value and feasibility scores determined with the evaluation scorecard, weights fixed before the evaluation
- Evaluation carried out jointly by the business unit, IT/data science, and risk/compliance
- Use case placed in the prioritization matrix and the quadrant’s recommended action adopted
- A responsible role (product owner) named
- Sourcing path (build, buy, partner) decided (see chapter B3)
- Value-driver chain formulated: activity changed, metric moved, corporate goal affected
- Baseline of today’s state captured
- Business case with range and sensitivity available
- Human approval planned for consequential actions
- The use case is captured and prioritized in the Portfolio Board
Common mistakes
A few failure patterns recur when selecting use cases. Knowing them helps spot them early:
- Technology-driven instead of value-driven: “We want to use AI” is not a use case.
- Ignoring data reality: the idea is good, but the data doesn’t exist in usable form.
- Underestimating inference costs: the pilot pays off, ongoing operation doesn’t.
- No success criterion: without a predefined measure, success can never be proven.
- Too many parallel pilots: focusing on a few that get carried through beats breadth.