A3. Maturity Assessment
Before a company invests deliberately in AI, it needs to know its own AI maturity. The maturity assessment delivers this picture: how well is the organization prepared for AI technically, organizationally, and culturally? Without this stocktake, investment goes to the wrong place, for example into an expensive platform when the real problem is poor data quality.
What this chapter delivers: a guide in five steps to be worked through in order, each with the input required, the concrete procedure, and the result. At the end stand your own maturity profile, the limiting bottleneck, and the measures derived from it. In the process model, this analysis is the Assess phase (see chapter C1).
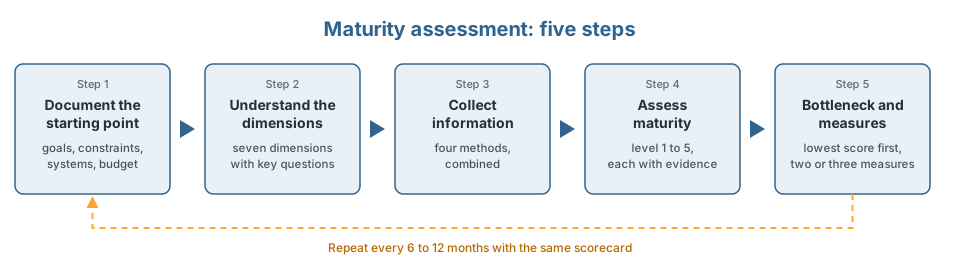
Step 1: Document the starting point and goals in writing
What to do: before anything is assessed, the starting point is documented on one to two pages, jointly by executive management and IT leadership.
What information is collected, with which guiding questions, and why:
| Information | Guiding questions for collection | Why it is relevant | Example entry |
|---|---|---|---|
| Business goals (reduce costs, new revenue sources, improve quality) | Which three goals take priority over the next two years? How is their achievement measured? Who owns them? | Without a link to goals, it is impossible to judge later whether AI initiatives succeeded. Every maturity assessment is measured against these goals. | Reduce handling time in customer service by 30 % by the end of 2027; owner: head of service |
| Constraints (target markets, products, processes, regulatory requirements) | In which markets and segments does the company operate? Which supervision and which requirements apply? Which processes are business-critical? | They determine which AI uses are permissible and sensible at all. | Life insurance business: AI-supported pricing falls under high-risk obligations (see chapter B8) |
| Existing systems and data sources | Which core systems hold which data? Where does it live (cloud, own data center)? How long does data access take today? | They are the foundation of every AI solution. If you don’t know which data lives where, you cannot assess feasibility. | CRM with ten years of customer history; access only via individual requests, taking three weeks on average |
| Previous AI initiatives (ongoing, failed, shadow AI) | What has already been tried, and with what result? What did it fail on? Which AI tools do employees use today without approval? | Failed attempts reveal the real obstacles; shadow AI reveals unmet demand (see chapter A1). | Chatbot pilot discontinued in 2024 because data access never materialized; business units use private chatbot accounts |
| Budget frame and available people | What budget is available for the first wave? Who can contribute, and at what capacity? Which competencies are missing in-house? | They limit which measures are realistic. An honest statement prevents roadmaps that are never implemented. | 200,000 euros for twelve months; one data-engineering position; no ML experience in-house |
Result of step 1: a short document with goals, constraints, system landscape, previous initiatives, and resources. It serves as the reference in all following steps.
What happens if this step is skipped: the assessment in step 4 hangs in the air. The typical outcome is a maturity score that nobody can connect to business goals and that therefore triggers no investment decision.
Step 2: Understand the seven assessment dimensions
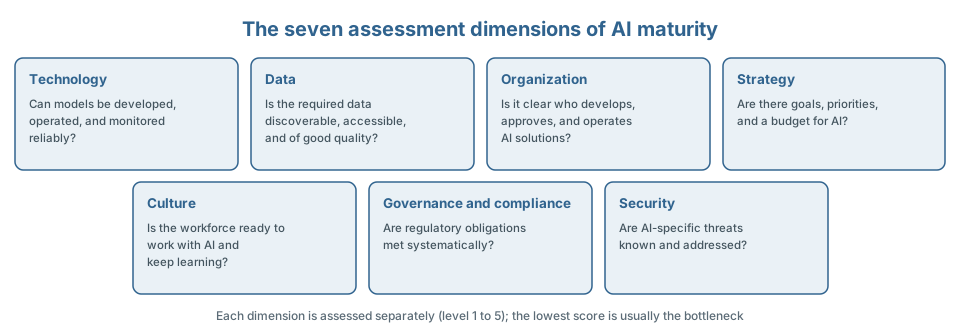
Maturity is not assessed as a single number but separately across seven dimensions. The reason: organizations are almost never uniformly mature. A company can be technologically advanced and still fail on missing roles or poor data quality. Only the separate assessment reveals where the bottleneck is. The seven dimensions and five stages of this work are a deliberately lean synthesis of common maturity models from consulting and research, tailored to direct use in the strategy process rather than to the completeness of a certification.
| Dimension | Key question | How maturity shows itself (evidence) |
|---|---|---|
| Technology | Can models be developed, operated, and monitored reliably? | Existing platform, versioning, monitoring, integration into core systems |
| Data | Is the required data discoverable, accessible, and of good quality? | Data catalog, documented quality, governed access, named owners |
| Organization | Is it clear who develops, approves, and operates AI solutions? | Defined roles, documented processes from idea to operations |
| Strategy | Are there goals, priorities, and a budget for AI? | Adopted strategy, investment plan, metrics |
| Culture | Is the workforce ready to work with AI and keep learning? | Training offers, error culture, acceptance in surveys |
| Governance and compliance | Are regulatory obligations met systematically? | AI register, risk classifications, approval processes (see chapter B8) |
| Security | Are AI-specific threats known and addressed? | Threat model, protection measures, test records (see chapter B9) |
Step 3: Collect information
Assessing the seven dimensions from step 2 requires reliable information: for each dimension, the answer to its key question along with evidence. Four collection methods have proven effective for this. They illuminate different aspects and should be combined, because each has blind spots on its own.
Method 1: Interviews with key people
- What: individual conversations of 45 to 60 minutes with 5 to 10 people: executive management, IT leadership, data owners, two or three leaders from business units.
- How: open questions along the seven dimensions, e.g., “Which AI initiatives have there been so far, and what came of them?”, “What did the last data project fail on?”, “Who decides today whether a model may go into production?”
- Why: interviews uncover what no document contains: culture, informal obstacles, resistance, diverging expectations between areas.
- Result: interview notes per dimension, especially qualitative input for culture and organization.
Method 2: Standardized questionnaire
- What: a questionnaire with 5 to 10 closed questions per dimension, sent to a broader circle (20 to 50 people from all affected areas).
- How: statements with an agreement scale, e.g., “I know whom to contact when I need data for an analysis” (1 = does not apply, 5 = fully applies).
- Why: the questionnaire makes assessments comparable and reveals gaps between areas. If IT rates data quality 4 and the business rates it 2, that gap itself is a finding.
- Result: numeric values per dimension and per area, as input for the scorecard in step 4.
Method 3: Analysis of existing systems and data
- What: review of the actual system landscape and data holdings by IT and data owners.
- How: work through concrete checks: does a data catalog exist? How many data sources are documented? Are there production models, and are they monitored? How long does it take to get data access?
- Why: interviews and questionnaires capture perceptions. The system analysis delivers objective facts and corrects overly optimistic self-assessments. Example: if the questionnaire says “data catalog exists” but the catalog hasn’t been maintained for two years, the analysis finding counts.
- Result: a fact list with evidence, entered into the scorecard as proof.
Method 4: Joint assessment workshop
- What: a half-day workshop with management, IT, and business units, once the results of methods 1 to 3 are available.
- How: results are presented per dimension, gaps between perception and facts are discussed, and a stage per dimension is agreed jointly (scale in step 4). Rule: every rating needs evidence. “It feels like a 3” doesn’t count.
- Why: the workshop creates a shared, accepted picture. An assessment that comes only from external consultants or only from IT will be doubted later and loses its steering effect.
- Result: the agreed scorecard, backed by evidence.
Optional additions: benchmarking against industry values and external assessments provide a neutral outside view. They don’t replace the internal collection; they validate it.
Step 4: Rate with the maturity stage model
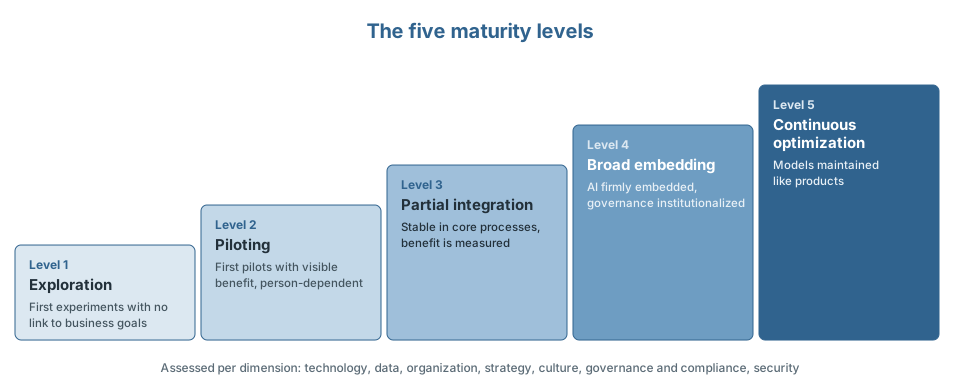
Each dimension is assigned one of five stages. The stages describe the path from first experiments to a fully AI-driven organization:
| Stage | Name | Characteristics |
|---|---|---|
| 1 | Exploration | First experiments with no link to business goals; scattered data; lighthouse projects without lasting impact |
| 2 | Piloting | First pilots with visible benefit; partially structured data; strongly dependent on individuals; little integration |
| 3 | Partial integration | Multiple solutions stable in core processes; roles, approvals, monitoring, and initial standards established; benefit is measured |
| 4 | Broad embedding | AI firmly embedded in value creation; standardized model operations; governance, security, compliance institutionalized; roadmap with metrics |
| 5 | Continuous optimization | Models and data products are maintained like products; decisions are data-driven; audits, transparency, explainability, fairness are standard |
Template: self-assessment scorecard
How to fill in the scorecard: each dimension receives a stage from 1 to 5 according to the maturity stage model above. The rating is agreed jointly in the workshop (step 3, method 4), and every stage needs an entry in the evidence column. A rating without proof doesn’t count; that is exactly where overly optimistic self-images creep in.
| Dimension | Stage (1 to 5) | Evidence | Most important gap | Next step |
|---|---|---|---|---|
| Technology | ||||
| Data | ||||
| Organization | ||||
| Strategy | ||||
| Culture | ||||
| Governance/compliance | ||||
| Security |
Completed example for one row:
| Dimension | Stage (1 to 5) | Evidence | Most important gap | Next step |
|---|---|---|---|---|
| Data | 2 | No maintained data catalog; access to sales data takes 3 weeks on average (system analysis) | No named data owners | Appoint data owners for the 3 most important domains (see chapter B4) |
Step 5: Identify the bottleneck, derive measures, plan the repeat
Identify the bottleneck: the lowest value in the scorecard is almost always the bottleneck. An organization scales AI no faster than its weakest dimension allows. Example: technology at stage 4 and data at stage 2 means the expensive platform sits idle because the data is missing. The next investment belongs in data, not in more technology.
Derive measures: for each bottleneck dimension, two or three concrete measures are formulated, with owners and dates. The “next step” column of the scorecard supplies the candidates. The measures feed into the roadmap (see chapter C2).
Plan the repeat: the maturity assessment is a measurement, not a one-off project. A repeat every 6 to 12 months with the same scorecard is recommended. Only the second measurement shows whether the measures worked.
Checklist: robust maturity assessment
The checklist verifies that all five steps were completed properly:
- Starting point and goals documented in writing (step 1)
- All seven dimensions rated, each backed by evidence
- At least three collection methods combined (interviews, questionnaire, system analysis)
- Rating agreed in a joint workshop by management, IT, and business
- Bottleneck dimension identified and named
- Two or three measures with owners and dates derived per bottleneck
- Repeat date for the next measurement set